Electric Brewing // Automating the Mashing Phase – 120 Volts // 1,650 Watts // 13.5 Amps

e0ea37709b79ffa48fec962b83e1b529

Up to now – we have been brewing with natural gas or propane, while this works really well, and there are many advantages, like nice strong boils, etc…, there are also some draw backs – as with everything.

Here are some of the benefits of using electric over gas:

  • no carbon-monoxide gas is created, as you are not burning gas, so safer
  • it is much (again) safer to control electricity with un-attended automation over gas
  • save time by pre-heated over night to strike temperature using a smart PID controller – read here: http://byo.com/malt/item/299-brewing-on-autopilot-with-pid-controllers this way, you can get straight to mashing and not waste time heating the water with gas
  • no need to waste time buying and hauling propane no more
  • since you are saving time, you could fit 2 batches in the same day; just fill the water, set your temp goal on the PID and go to do something else…
  • Electric is much more efficient, 100% of the energy transfers into the wort, where as with gas only about 25% (the other 75% is byproduct of heat), which you have to ventilate for.
  • many more…

Voltage Choice ?

You will have with two choices, which you need to think about and consider for your needs and goals.  You can build your system around 120 volts or 240 volts.  Obviously it is easier to use 120 volts, since all electrical outlets by default have that everywhere in the US and only Driers and Oven ranges would have the cabling setup for 240 volts, unless you live in Europe :- ) then you have 220 volts.

A good way to wet your feet is to start with 120 volts and automate the heating for the mashing phase of the brewing.  Since mash out temps. are about 170F Max and everything between at lower ranges, you won’t really have the need to heat beyond that, so you can use lower wattage heating elements.

Drills or Punches ?

You have a choice of either making the holes using drills or hole punches.  There are many videos on youtube on that, so search away for your pot type and size.  We drill a hole and then thread it for smaller holes and for bigger holes, we drill a hole (threading has little value) because the thickness of the material is not sufficient enough to have the proper threads – so you will have to use rubber seals and lock nuts.  If you know how to weld, you don’t need instructions from us :- )

elec_keg120160911_091214

For this project we used a 1,650 watt stainless steel heating element, using 120 volts.  1650 watts / 120 volts = 13.75 Amps.  So when you buy a Relay, make sure it is rated above that, always good to have a nice buffer when it comes to electricity.  Most SSR Relays start in about the 25 Amp range, so you are good to go.

PID – great info from BYO magazine, many different ones exist, don’t buy cheap ones and make sure it supports F if you don’t like C for temp., its best to get familiar with options and specs, so do some research – http://byo.com/malt/item/299-brewing-on-autopilot-with-pid-controllers

We *do really* recommend that you buy the more expensive American made Auber controller, their quality is much better and they are rated for 10Amps without the need for a Relay, if you are going to stay under 1200watts.  Our experience with the cheaper Chinese made PIDs like the MYPIN, etc.. were poor, a lot of wasted time, it breaks easily, just cheap overall construction and I doubt their QA process // but you might have other luck – be warned, you do actually get what you pay for, that’s why people say this :- )

We don’t recommend the MyPIN or any other Brands out of China – seriously, their quality is not that good, on the other hand, there are good ones coming out of Japan, but do your research first.

The FOTEK solid state relays seem to perform well – time will tell if they still work after 5 years.  Make sure the model of your PID will work with a solid state Relay and will support your temperature probe.  Not all PIDs work with solid state, check the specs and ask before ordering.

temperature-controller-1

We Recommend the Auber PID – see the manufacturers web site for different kinds:

http://www.auberins.com/?main_page=index&cPath=1

we use this one: http://www.auberins.com/index.php?main_page=product_info&products_id=3

82b9_12

Here is what we used (1,650 watts stainless steel), but again – there are many different wattages and even shapes, so do your research – we recommend stainless!!!

s-l500

This is the heating probe that we used – RTD Pt100 Temperature Sensor Probe Cable 3 Wires 1/2″ NPT 750°F for Temp Control – don’t get a cheap one and think about its placement relative to your needs and batch volume size.  s-l1600-1

Hooking it up ?

Most people will install the PID inside some kind of a Control Panel casing // here you can be as creative as you want, since this is for #homebrew, just try everything safely and properly, take your time and research, if you are not sure.

Many great videos exist on youtube – we recommend, you do some research again // Video will be posted later of final control panel.


Posted in Beer Brewing Equipment | Tagged , , , , , , , | Comments Off on Electric Brewing // Automating the Mashing Phase – 120 Volts // 1,650 Watts // 13.5 Amps

Beeruino // An Intelligent beer data logger and controller

Beer + Arduino + # = #Beeruino


Beeruino – is an #arduino based data logger and controller project that I dreamt up after my second pint of #homebrew.  Here is an older video before the buttons were added for more flexible control.


What is it made of ?

  • Black project box (Radio Shack), donated to me by a fellow brew head
  • Originally using Arduino UNO R3 // Recently upgraded to the Mega 2560 R3 (more memory!)
  • Ethernet Sheild (gives Ethernet and SD card capability)
  • Prototyping shield
  • RTC (real-time-clock) using I2C bus (give accurate date/time)
  • dual 10 amp relay module (120 volt x 10 amp = 1200 watts)
  • dual A/C sockets, independent of each other (so different things can be controlled out of each socket)
  • 4×20 LCD screen using the I2C bus
  • ON/OFF switch
  • Arduino sketch C++ code
  • USB Cable
  • Power Cable to power the A/C sockets
  • Analog buttons to change the set goal temperature UP or DOWN on the control relay, and to RESET the DATA storage on the SD card

Beeruino now has control buttons and Version 2 of the code has been released.  They allow you to control the target goal temperature without the need to change the value manually and no need to recompile the program using the computer, making it more independent and flexible as a tool.

All the versions of the code are maintained GitHub: https://github.com/rompstar/beeruino

Importing, Verifying, Analyzing and Plotting the Data:

I like to analyze the data using R (open-source) statistical software, that can do a lot more than just statistics, so don’t let that scare if you are not familiar or good with math/numbers.

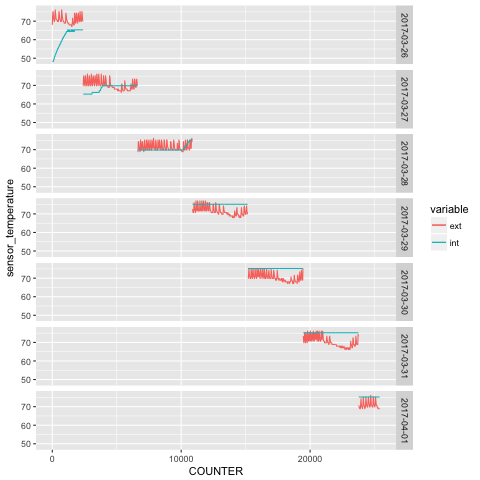
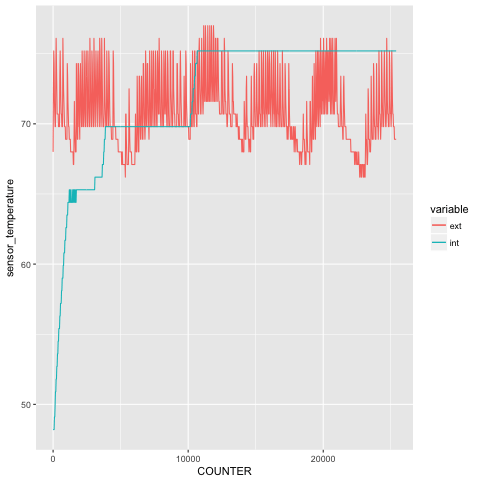
Basically data in imported into R from the textfile.txt off the SD card, then I do some quick summary verification, I take a sample every 25 row and plot it in two different way using ggplot2.  Temperature of internal/external split by day and also the whole plot in one not segmented or split.

These two plot show a simple test run on plain water in a 12.5 gallon fermentor. 

Started with cold 44F well water, turned on Beeruino and set temperature goal to 65F, then later raised it to 70F and again for the duration of the test to 75F.

Here is a simple R script, this assumes you have some limited know-how in using R, if not do our self a favor and learn it.


# import the data into R from the testfile.txt
BeerData <- read.csv(file="./beer_analysis/HTCON.TXT", header=FALSE, sep=",")

class(BeerData) # should be data.frame
summary(BeerData)

# sample some data every 25th row from the whole data set
# so total_data / 25 are the number of observations used in the plots
BeerData2 = BeerData[seq(1, nrow(BeerData), 25), ]

head(BeerData2)

# give columns more meaningful names
# load up the plyr package, install that if you are missing it
install.packages("plyr")
library(plyr)     # existing_name=new_name
BeerData3 <- rename(BeerData2, c("V1"="COUNTER", "V2"="HEAT_INDICATOR", "V3"="EXTERNAL_TEMP","V4"="INTERNAL_TEMP","V5"="DATE_TIME_STAMP"))

head(BeerData3)

# Set up the Axis from the Variables
ext <- BeerData3$EXTERNAL_TEMP # ext. temp.
int <- BeerData3$INTERNAL_TEMP # int. temp.

summary(BeerData3)
install.packages("ggplot2")
library(ggplot2)

# plot to a file, (it won't diplay anything on the screen)
# if you want to display comment out the # png() and dev.off() rows...
png("whole_plot.png", width=480, height=480)

ggplot(BeerData3, aes(COUNTER, y=sensor_temperature, color = variable)) + 
  geom_line(aes(y = ext, col = "ext")) + 
  geom_line(aes(y = int, col = "int"))

dev.off()

png("day_split_plot.png", width=480, height=480)

ggplot(BeerData3, aes(COUNTER, y=sensor_temperature, color = variable)) + 
  geom_line(aes(y = ext, col = "ext")) + 
  geom_line(aes(y = int, col = "int")) +
  facet_grid(as.Date(BeerData3$DATE_TIME_STAMP, format="%Y/%m/%d") ~ .)
  
dev.off()


Posted in Arduino-RaspberryPi-Make-Beer | Tagged | Comments Off on Beeruino // An Intelligent beer data logger and controller

Beer Fermentation Beer Data Logger // Beer Analytics

Update: since this blog was written, the Project was transferred to a more professional looking project box and is now called the Beeruino, please search to see that blog – also code has been posted to Git.

parts used:

  1. empty cigar box (smaller plastic project boxes also are ideal, but cigar box was free)
  2. Arduino UNO R3
  3. Arduino UNO R3 compatible ethernet shield + SD card that plugs into the SD slot
  4. two Dallas 1-wire temperature sensors (1 meter long, internal cable length was extended)
  5. 4×20 blue LCD Screen – works over I2C
  6. an RTC (real-time-clock), also works over I2C
  7. miscellaneous: wires, shrink wraps, hot glue, plastic wire ties and some light soldering

If you are one of those people – who is reading this and inside your head you are saying “why the hell should I do any of this shit, I just buy!!” – guess what, you are not a Maker and you will learn nothing from buying things that others have created.  Once you learn, you have full control over your creation and any future ideas/goals, you are not tied to a product that someone else has created.

In this quick blog I wanted to share a quick story about how I converted an empty cigar box into a data logger.  It uses the Arduino Uno and two Dallas 1-wire sensor to capture and record both the internal temperature inside the fermentor and the external temperature (outside the fermentor), so that we have a base to compare against.  You should see a higher temperature inside, because when yeast ferments, that is considered an exothermic process – https://en.wikipedia.org/wiki/Exothermic_process

The primary goal was to create a small, portable system (small size and weight wise) and also for it to be independent, meaning be able to do everything on its own without external dependencies like the internet, or some network, at this stage we don’t want to send live data to the internet or log to a database // but those things can certainly be done and in the future can be nice to have.

To have this system somewhat nice, I have added a 4×20 blue LCD screen – it uses the I2C interface to make the hook up easy.  Also an RTC (real-time-clock) was installed to work on the same I2C bus, this adds date+time.

In addition I have used 4-pin aviation plugs to make the sensors connection modular, so that they can be easily unplugged (cleaning or swapping) without messing with the internal electronics or wires…

Hot glue was used to stick things in place inside the cigar box, along with some limited soldering, and shrink-wrap, and wire ties to keep things organized and properly connected for solid connections.

The programming code is not super complex, and it being shared below:

It assumes that the external temp. sensor is being pulled from index(0) and internal from index(1).  Having the temp sensors assigned to a static index will allow you to switch the aviation plugs and still have them assigned correctly and display from the right sensor without having to worry about which plug which should be.

A quick video and Arduino C++ code below…

The data is recorded on an SD card (inside the ethernet shield) which is plugged-in on top of the Arduino UNO R3.


#include <Wire.h> 
#include <LiquidCrystal_I2C.h>

LiquidCrystal_I2C lcd(0x27,20,4);  // set the LCD address to 0x27 for a 16 chars and 2 line display

#include <OneWire.h>
#include <DallasTemperature.h>
 
#include <SPI.h>
#include <SD.h>
File myFile;

const int chipSelect = 4;
unsigned short int counter = 0; // value range between 0 to 65,536 // we have no need to store negative value ranges 
 
// Data wire is plugged into pin 2 on the Arduino
#define ONE_WIRE_BUS 2
 
// Setup a oneWire instance to communicate with any OneWire devices 
// (not just Maxim/Dallas temperature ICs)
OneWire oneWire(ONE_WIRE_BUS);
 
// Pass our oneWire reference to Dallas Temperature.
DallasTemperature sensors(&oneWire);
 

void setup(void)
{
  lcd.init();                      // initialize the lcd 
  lcd.init();
  
 // start serial port
 Serial.begin(9600);
 
 // Start up the library
 sensors.begin();
 
  while (!Serial) {
    ; // wait for serial port to connect. Needed for native USB port only
  }
 
 Serial.print("Initializing SD card...");
 
 // see if the card is present and can be initialized:
 if (!SD.begin(chipSelect)) {
 Serial.println("Card failed, or not present");
 // don't do anything more:
 return;
 }

 Serial.println("card initialized.");

 // use this code if you want the file removed upon device reboot or reset ???
 //Serial.println("Removing file.txt...");
 //SD.remove("file1.txt");
 
 if (SD.exists("brewday2.txt")) {
 Serial.println("file1 exists.");
 } else {
 Serial.println("file1 doesn't exist.");
 }
 
}
 
void loop(void)
{
 delay(5000);

  lcd.backlight();
  lcd.setCursor(0,0);
//  lcd.print("kodiakbrewing.com ");
  lcd.print("Log Counter: ");
  
  lcd.setCursor(13,0);
  lcd.print(counter);

  lcd.setCursor(0,1);
  lcd.print("log to: brewday2.txt");
  lcd.setCursor(12,1);
  
  
  lcd.setCursor(0,2);
  lcd.print("Int. Temp: ");
  lcd.setCursor(11,2);
  lcd.print(sensors.getTempCByIndex(1) * 1.8 + 32.0); // Convert to F

  lcd.setCursor(0,3);
  lcd.print("Ext. Temp: ");
  lcd.setCursor(11,3);
  lcd.print(sensors.getTempCByIndex(0) * 1.8 + 32.0); // Convert to F
  
 
 sensors.requestTemperatures(); 
 Serial.print("External Temperature is: ");
 Serial.print(sensors.getTempCByIndex(0) * 1.8 + 32.0); // Convert to F
 Serial.print('\n');
 Serial.print("Internal Temperature is: ");
 Serial.print(sensors.getTempCByIndex(1) * 1.8 + 32.0);
 Serial.print('\n'); 
 Serial.println(counter);
 
 // make a string for assembling the data to log:
 String external_temp = "";
 String internal_temp = "";
 
 // read the two sensors and append to the string:
 external_temp = String(sensors.getTempCByIndex(0) * 1.8 + 32.0);
 internal_temp = String(sensors.getTempCByIndex(1) * 1.8 + 32.0);

 
File dataFile = SD.open("brewday2.txt", FILE_WRITE);
 
// counter = counter + 1;  
counter++;
 
 // if the file is available, write to it:
 if (dataFile) {
 dataFile.println(String(counter) + "," + external_temp + "," + internal_temp);
 dataFile.close();
 }
 // if the file isn't open, pop up an error:
 else {
 Serial.println("error opening file.txt");
 }
 
 
}


Posted in Arduino-RaspberryPi-Make-Beer | Comments Off on Beer Fermentation Beer Data Logger // Beer Analytics

American Brown Ale 10 gallon batch


20160319_120209

attempt #1 pic below – Brew date: 3/26/1016

american_brown_ale-attempt1

attempt #2 pic below – Brew date: 7/10/2016

20160812_180653

10 gallons.

This beer was modeled after the Diamond Knot Brown Ale per the grains/hops posted on their web site, and simulated for ABV/SRM and IBU using app “Wort Pro”.

http://www.diamondknot.com/the-beer/always-on/brown-ale/

Videos of the brew are below:

adding flaked oats to mash: – add sweetness and body – read…

start of boil (using hop balls for whole hops so they don’t plug up the pipes):

transfer to fermentor:

adding yeast:

next day fermenting:

Attempt #1 – OG 1.068 // FG 1.010 – final ABV 7.6% – yes a little higher then the 6.0% Diamond Knot..

  • IBU 25.8
  • SRM 13

Attempt #2 – OG 1.066 // FG 1.014 – final ABV 6.83%

  • IBU 28.3
  • SRM 13

Total water used 15.5 gallons for final 10 gallons of beer…

attempt #1 grains:

  • 18 lb Pale Malt 2-row
  • 4.5 lb Munich Malt 10 love
  • 3.0 lb Crystal Malt 10 love – see below for attempt #2 changes
  • 0.20 lb Chocolate Malt
  • 0.20 lb Black Barley
  • 1.0 lb flaked Barley
  • 1/2 lb of brown sugar

attempt #2 grains:

  • 18 lb Pale Malt 2-row
  • 4.5 lb Munich Malt 10 love
  • 1.5 lb Crystal Malt 15 love
  • 1.5 lb Crystal Malt 60 love – we did this to give the beer more caramel flavor and beer body
  • 0.40 lb Chocolate Malt – we double the dark grains to darken the color a bit
  • 0.40 lb Black Barley
  • 1.0 lb flaked Barley
  • 1/2 lb of brown sugar – we didn’t use it this time, the sugar…

hops attempt #1:

  • 2.0 oz Galena with some whole hops from last year’s harvest (Yakima & Cascade) at start of boil, added to the hop boil ball, see video.
  • 2.0 oz Willamette last 15 minute of boil.

hops attempt #2:

  • 2.0 oz of home grown Cascade Hops, 2015 harvest (beginning of boil)
  • 1.0 oz of Cascade pallet + 1.0 oz Willamette pallet (last 15 minutes)

attempt #1 – Wyeast #1056 yeast was used, took 2 weeks to ferment out, this yeast consistently bubbled over the 2 week period…

attempt #2 – British Ale Wyeast #1098 // 2 liter starter // 1.040 gravity – majority of the active fermentation will be over in about 4 days, but let it go out full 2 weeks – because it’s still happening, just slower, also we like to allow extra time for all the floaters in the fermentor to settle.  On that note, per one of our brew nerds – once fermentation is over, trapped dissolved co2 gas slowly escapes the beer, so it will give you a false sense of a fermenation – only way is to measure.

attempt #3 – 11/11/18 – all same as attempt #2, expect for yeast – we used WLP002 English Ale… OG 1.052 / started the mash schedule at 138F and slowly ramped to 152F in 1 hour, then held at 152F for an additional 30 minutes for 90 minute total mash / this mash schedule produced much a better efficiency compared to OG of 1.040 in attempt #2

Beer tastes awesome – Fermentation was 2 weeks, which included 1 week rest time – this helps the yeast to reabsorb any unwanted off-flavors, in keg for only a few days!  Boom, a winner!

Posted in BEER Home Brewing | Tagged | Comments Off on American Brown Ale 10 gallon batch

Version 2.0 // Python temperature logging script Arduino + Raspberry Pi

temp_jig

Above is a temperature probe jig, it captures and logs the temperature from inside of the fermentor.

beer_sample_plot2

Plotting the data using a web API:

The plot above was generated using sample data and the service – https://plot.ly ( once you capture the data, you can upload your data_file.dat there and with a few clicks, make the graph ) – until you learn how to manually write the plot code in python.

Plotting the data using python code:

In the python code for the log – if you use this line to capture the data, then you can manually run the python code and it should generate a plot if you installed python right with all the necessary modules – this is considered machine readable the way that time.time is written to the file.  If you use the DATE/TIME instead, then I haven’t figured this out yep, so we use the web API (above) and upload the data and generate the graph like that.

logFile.write('{:10.0f}\t{:3.2f}\n'.format(time.time(),temperature))

a quick python plot example below:

plot

sample code to generate a plot from the sample data.

from matplotlib import pyplot as plt
from matplotlib import style
import numpy as np

# select the style
style.use('ggplot')

# unpack values into array when using numpy // python uses lists
x,y = np.loadtxt('test3.dat', unpack=True, delimiter='\t')

plt.plot(x,y)

# configure the labels
plt.title('temperature plot')
plt.ylabel('Y Axis')
plt.xlabel('X Axis')

plt.show()


Dynamic Temperature Python script…

Version 2.0 // logging of temperature code with appended date.  This version checks to see if the previous recorded sample is the same, if it is, it is skipped and not recorded.  This is useful to have when you are wanting to monitor and record temperatures over a long time, like months or a year and not waste data space on repeating values.

This code can be pretty much used with any temperature sensor, we use it with the Dallas DS18S20.

Let me briefly explain what the code is doing ( from top to bottom ), but I strongly recommend that you take some basic classes on Python, we are still learning it too :- ) that is the only way to take full advantage of it and learn a new skill – Python is a good thing to have on your resume these days too :- )

Special thanks go to “Ofnuts” (the person who helped up with the syntax to get this done from the python help forum)!

  1. we are importing some modules
  2. we are setting up some variables like LOGFILE_FORMAT & TIMESTAMP
  3. def – means defining a function, so we are defining a function called: logTemperature() – it does the logging of the temperature with an appending timestamp to a text file
  4. setup the serial connection from the Arduino over the USB cable
  5. last_temp_reading = – 273 (we are setting up a unrealistic condition for comparison temperature)
  6. the rest of the code checks for a clean string coming from the Arduino and converting it into a float so that an inequality check can be done
  7. a lot of the extra Printing was also done to test, you can take those out if you are not going to be looking at the screen and running the command in the background using nohup.
  8. If you know Python remove and add whatever you need and share with us if you end up doing something cool
import serial, datetime
from datetime import datetime
import time

LOGFILE_FORMAT = '%Y-%m-%d.dat' # could also contain a path: '/home/brewery/temperatures/%Y-%m-%d.dat'
TIMESTAMP_FORMAT = '%Y-%m-%d %H:%M:%S' # better make them human readable

LOGFILE_FORMAT_FILE_NAME = '/home/pi/python/datalog_onefile_test2_dynamic.dat'

def logTemperature(temperature):
    if not temperature:
        return; # no need to go further
    now=datetime.now() # get it only once to insure consistency
    logFilename=now.strftime(LOGFILE_FORMAT_FILE_NAME)
    loggedTimestamp=now.strftime(TIMESTAMP_FORMAT)
    logFile=open(logFilename,'a')
    logFile.write('{:s}\t{:3.2f}\n'.format(loggedTimestamp,temperature))
# if you want the decimal part of the time to be dropped use below line instead
# un-comment it and replace the .write line above
    # logFile.write('{:10.0f}\t{:3.2f}\n'.format(time.time(),temperature))
    logFile.close()

#define for the USB serial connection between the Raspberry Pi/Arduino Uno
ser = serial.Serial('/dev/ttyACM0', 9600, timeout=1)
ser.close()
ser.open()

last_temp_reading = -273

while True:
    temp = ser.readline().strip() # get something clean from the start
    if temp:   # a non-empty string is "True", an empty string (or None...) is "False"
        temperature = float(temp)
        print "printing variable", temperature
        print "printing temperature variable", last_temp_reading

# dynamic sampling, ignoring repeating temperature samples
        if last_temp_reading != temperature: # assumes you can't get a reading of -273, so first execution will always see this as true.
            print "temp is different, recording it!", temperature
            logTemperature(temperature)
            last_temp_reading = temperature
        else:
            print "temp is the same, ignoring it!!!", last_temp_reading


Posted in Arduino-RaspberryPi-Make-Beer | 1 Comment